
The district total barely moved at 2,020. But 18 to 24 year olds on the count rose 56% in two years, the steepest in Cambridgeshire, while over-25 claims fell.
350 people aged 18 to 24 in South Cambridgeshire were claiming unemployment benefits in July. That is the highest count for the age group since October 2021, and it is up 56% in two years.
The district total tells a very different story. It stood at 2,020 in July, against 1,875 two years ago, a rise of about 8%. As a share of residents aged 16 to 64 it has held steady at 1.9% for two years running.
The figures are the ONS claimant count, published through nomis alongside the UK labour market bulletin on 18 August.
One age group is rising, the others are not
The headline looks still because two trends are cancelling out. Claims by people aged 25 to 49 have fallen slightly. Claims by under-25s have risen much faster than anything else.
| Age group | July 2024 | July 2025 | July 2026 | Two-year change |
|---|---|---|---|---|
| 18 to 24 | 225 | 295 | 350 | +55.6% |
| 25 to 49 | 1,150 | 1,170 | 1,135 | -1.3% |
| 50 and over | 495 | 510 | 530 | +7.1% |
| All aged 16+ | 1,875 | 1,980 | 2,020 | +7.7% |
Within the youngest group, 210 of the 350 were aged 18 to 21.
The climb has been steady rather than sudden. The 18 to 24 count sat at 225 through the middle of 2024, passed 300 in the autumn of 2025, and has not been below 325 in any month since November.
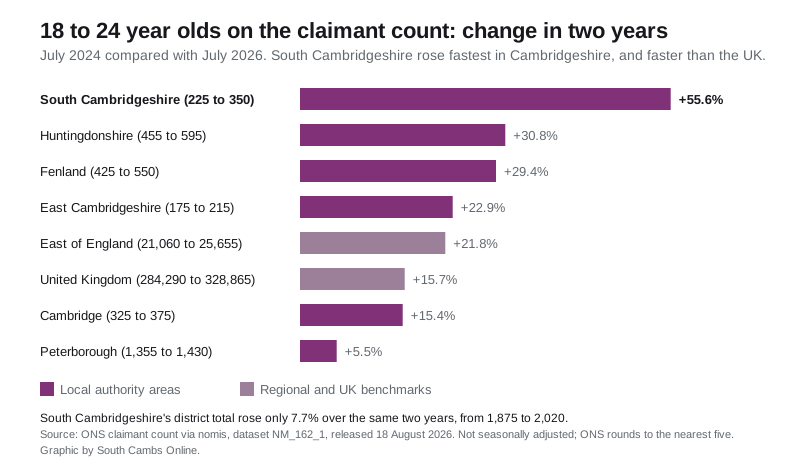
The steepest rise in Cambridgeshire
South Cambridgeshire’s increase is the largest of the county’s five districts, and it is more than three times the UK rate.
| Area | July 2024 | July 2026 | Change |
|---|---|---|---|
| South Cambridgeshire | 225 | 350 | +55.6% |
| Huntingdonshire | 455 | 595 | +30.8% |
| Fenland | 425 | 550 | +29.4% |
| East Cambridgeshire | 175 | 215 | +22.9% |
| Cambridge | 325 | 375 | +15.4% |
| Peterborough | 1,355 | 1,430 | +5.5% |
| East of England | 21,060 | 25,655 | +21.8% |
| United Kingdom | 284,290 | 328,865 | +15.7% |
Peterborough is a separate unitary authority rather than part of Cambridgeshire county. Across the county itself the 18 to 24 count went from 1,605 to 2,080, a rise of 29.6%.
Over the most recent twelve months alone the picture is less unusual. South Cambridgeshire rose 18.6% between July 2025 and July 2026, behind Fenland’s 32.5%. It is the two-year span that sets the district apart.
What the claimant count does and does not measure
Four things are worth holding on to before reading too much into any of this.
- It is not the unemployment rate. The count includes people who are working but on low earnings, where Universal Credit rules require them to look for more or better-paid work.
- The figures are not seasonally adjusted. July always picks up school and college leavers, which is why every comparison here is July against July.
- ONS rounds to the nearest five. At these small numbers one rounding step is worth about 1.5% on the under-25 figure, so treat the percentages as approximate.
- Small bases move easily. The two-year rise is 125 people. The direction has held for two years, which is what makes it worth reporting, but the absolute numbers are small.
What it means for you
If you are under 25 and out of work here, the figures say you are not an outlier. There were 350 people your age on the count in July, and the number has been rising for two years.
If you are claiming and struggling with bills, the district council keeps a list of local help at advice and support with money, and there are separate council tax discounts and support you may qualify for while your income is low.
If you are looking for work, Find a job is the government’s own vacancy service, and the National Careers Service gives free advice at any age.
If you employ people here, this is the age group whose supply has grown. It also coincides with the first cohorts leaving the district’s new post-16 provision, including Cambourne Sixth Form.
The August 2026 claimant count is due from ONS on 15 September. For what else is changing locally, see our planning news and house prices.
Have your say