
The district average hit £436,011 in June, up 2.9% in a month, the 7th biggest rise in England. Cambridge fell, and the gap between them has almost halved.
The average South Cambridgeshire home sold for £436,011 in June. That is £12,142 more than in May, a rise of 2.9% in a single month.
Only six of England’s 295 local authority districts moved faster. The figures come from the UK House Price Index, which HM Land Registry published at 9.30am on 19 August. It is built from completed sales, not asking prices.
The districts that beat South Cambridgeshire in June were:
- City of London, up 14.2%
- Slough, up 5.2%
- Newcastle-under-Lyme, up 5.0%
- Burnley, up 4.6%
- Kingston upon Thames, up 3.1%
- Lancaster, up 3.0%
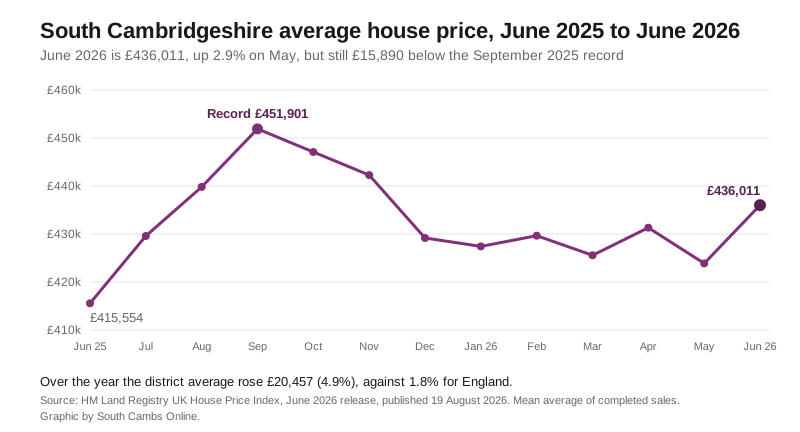
Up 4.9% on the year, against 1.8% for England
Over twelve months the district average rose £20,457, or 4.9%. June 2025 was £415,554.
That is well ahead of the national picture. England rose 1.8% to £293,262 over the same year, and the East of England rose 1.1% to £338,707. Sixty-two of the 295 English districts fell.
South Cambridgeshire ranks 76th of 295 on annual growth and 60th on price.
The Cambridge gap has almost halved
The sharpest local point is next door. Cambridge is the only Cambridgeshire district where prices fell over the year, down 1.2% to £471,098.
The two areas have been converging fast:
- June 2025: Cambridge £476,594, South Cambridgeshire £415,554, a gap of £61,040
- June 2026: Cambridge £471,098, South Cambridgeshire £436,011, a gap of £35,087
The village ring is closing on the city at roughly £26,000 a year. On these figures, the price advantage of moving out of Cambridge is a good deal smaller than it was.
Across the county in June 2026:
| Area | Average price | Change on the year |
|---|---|---|
| Cambridge | £471,098 | -1.2% |
| South Cambridgeshire | £436,011 | +4.9% |
| East Cambridgeshire | £344,211 | +6.1% |
| Huntingdonshire | £306,387 | +3.1% |
| Fenland | £223,168 | +1.9% |
| Cambridgeshire | £336,451 | +3.1% |
| England | £293,262 | +1.8% |
Still £15,890 below the September peak
A strong month does not mean a record. South Cambridgeshire’s highest average on record was £451,901 in September 2025. June is £15,890, or 3.5%, below that.
The year in between was choppy rather than steadily rising. The district recorded annual falls in December, January, February and March, then turned positive again in April. Anyone reading a single month as a trend should look at that run first.
Terraced and semi-detached rose fastest
By property type in June 2026:
| Type | Average price | Change on the year |
|---|---|---|
| Detached | £631,491 | +4.3% |
| Semi-detached | £399,838 | +5.8% |
| Terraced | £326,010 | +5.8% |
| Flat or maisonette | £199,123 | +2.9% |
The cheaper end of the market moved most, which matters for anyone buying a first home here. The first-time buyer average was £346,755, up 5.5% on the year. For people who already own, the former owner-occupier average was £514,919, up 4.5%.
Three things to hold in mind about these numbers
It is a mean, not a median. The UK House Price Index averages every completed sale, so a handful of large village sales pulls the figure up. Half of homes sold here went for less than the headline.
The latest month gets revised. May was first published as £422,363 and has now been restated as £423,869, an increase of £1,506. June’s £436,011 will move too when the July index is released at 9.30am on 16 September.
Sales volumes lag. The Land Registry does not publish a sales count for the two most recent months, so the newest reliable figure is April 2026, at 105 completed sales. Comparisons with spring 2025 are also distorted by the stamp duty threshold change on 1 April 2025: the district recorded 433 sales in March 2025 and 90 in April 2025, against 107 and 105 in the same two months of 2026.
What it means for you
If you are selling, the June figure is the first real evidence in months that the district is pulling ahead of the national market. It is also a first release, and one month at district level is a small sample. Price against completed sales on your own street rather than the district average.
If you are buying in Cambridge instead, run the numbers again. The saving from moving to a village has fallen by about £26,000 in a year, and Cambridge’s own average is held down by its large share of flats.
If you are a first-time buyer, the £346,755 average is £18,168 higher than a year ago. Terraced homes, the usual first rung here, rose 5.8%.
If you are appealing your council tax band or checking a valuation, use the sold prices for your postcode rather than the index. The index measures the district.
Our South Cambridgeshire house prices page sets out what each village costs and has been updated with the June figures. For what is being built and where, see our planning news, and for getting into Cambridge and London, see trains and travel.
Update, 20 September 2026. HM Land Registry has revised June’s figures since this article was published. The district average for June is now recorded as £433,733, £2,278 lower than the £436,011 published on 19 August. The monthly rise is now recorded as 2.4% rather than 2.9%, and the annual rise as 4.4% rather than 4.9%. The England ranking above was worked out from the figures as first published. Our July 2026 report has the current numbers.
Have your say